Key performance indicators
Net Sales

0

19.1%
EBITDA*

0

4.7%
Profit After Tax

0

5.5%
(excluding exceptional items)
Earnings Per Share (EPS)

0

5.5%
(excluding exceptional items)
Book Value Per Share

0

12.1%
Dividend Per Share (DPS)

0

10.0%

(STANDALONE)

Profit & Loss Metrices
Net Sales (` in crores)
EBITDA (` in crores)
PROFIT AFTER TAX (` in crores)

(excluding exceptional items)

EARNINGS PER SHARE (EPS) (`)

(excluding exceptional items)

BOOK VALUE PER SHARE (`)
DIVIDEND PER SHARE (DPS) (`)

Y - O - Y Growth/Degrowth

^ Previous year’s figures restated on account of merger (refer Note 56 of Standalone Financial Statements)
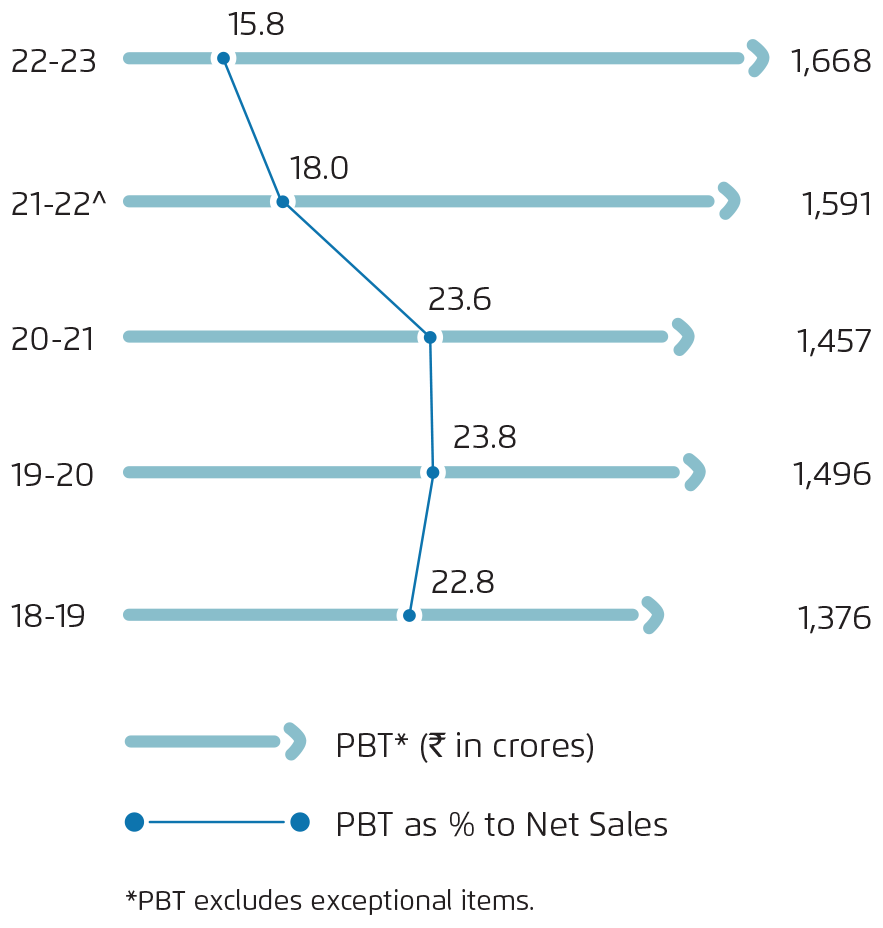
* EBITDA = Profit Before Tax before exceptional items (PBT) + Finance Cost + Depreciation - Other Income

Balance Sheet Metrices
Net Current Assets (` in crores)
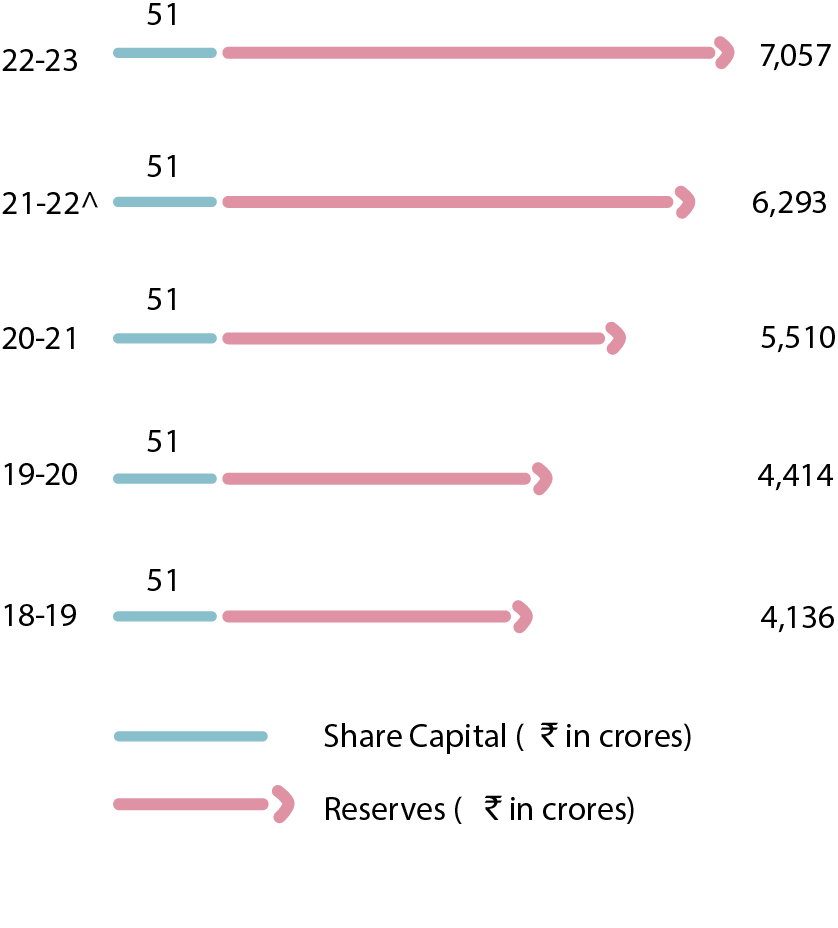
Reserves (` in crores)
Return on Average Net Worth (%)
Return On Average
Capital Employed (%)

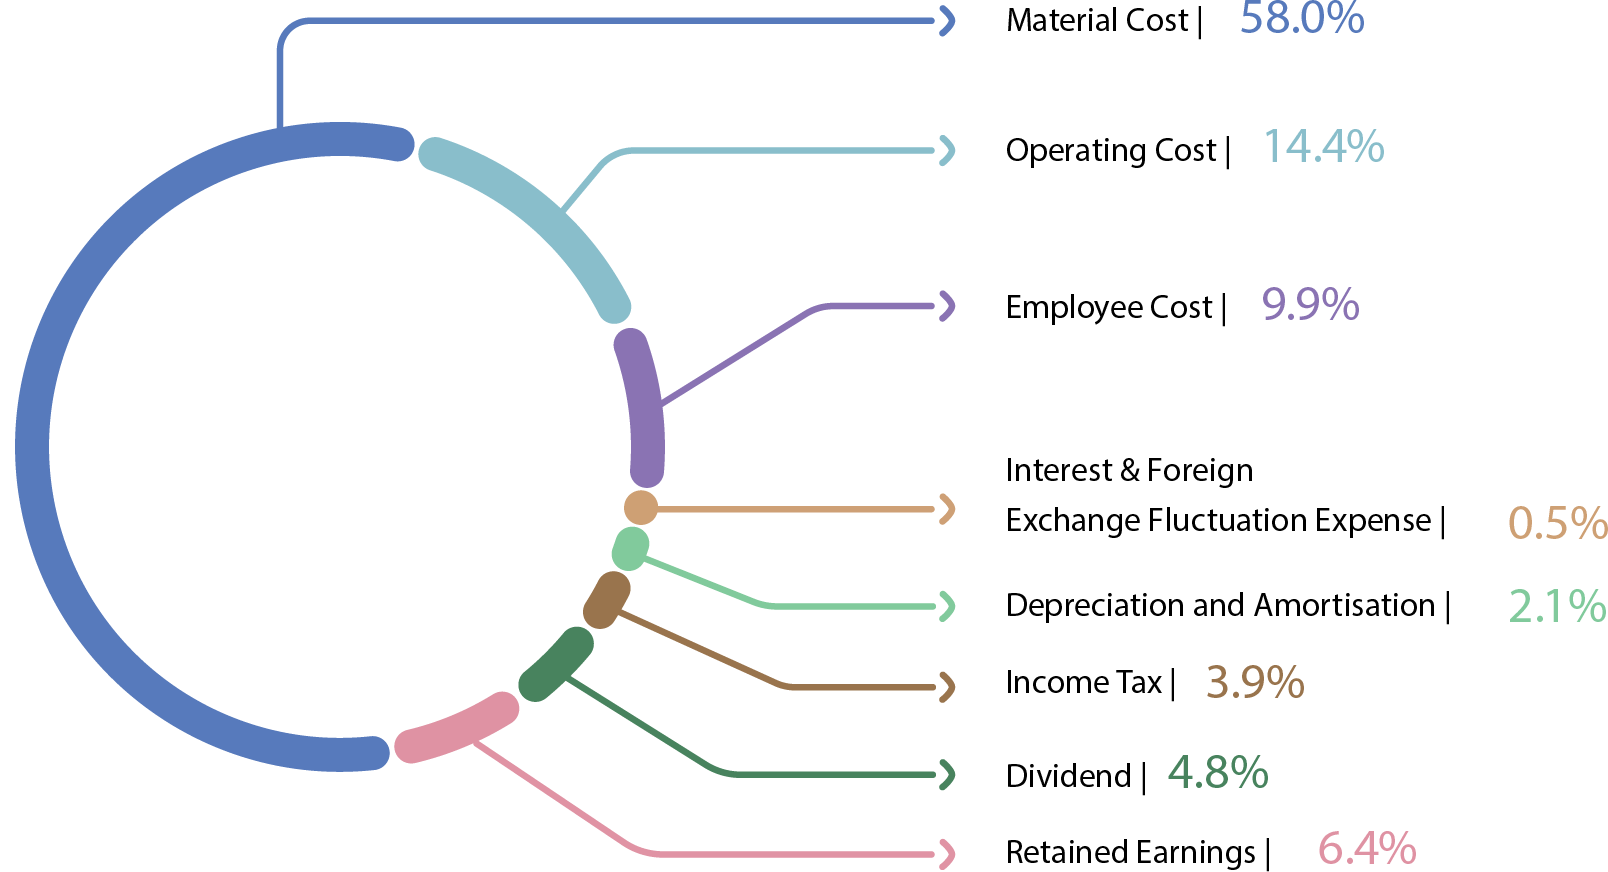
Distribution of Revenue
2022-23

^ Previous year’s figures restated on account of merger (refer Note 56 of Standalone Financial Statements)
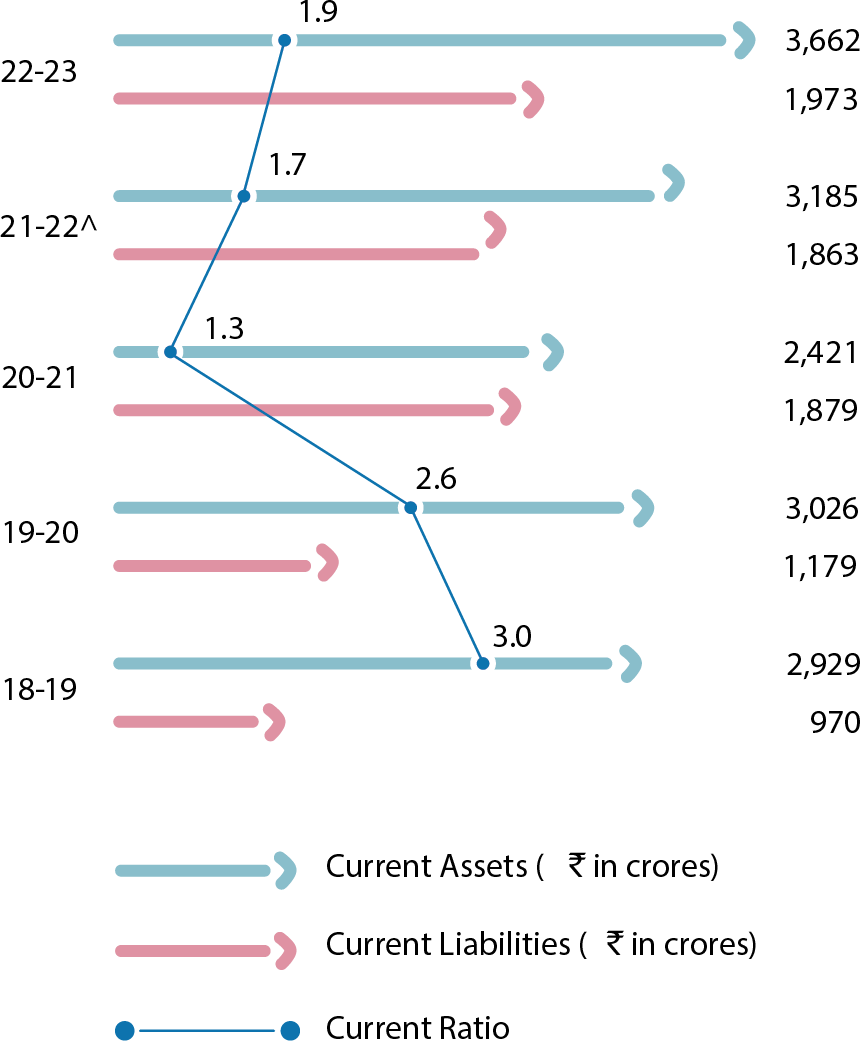
Current Ratio
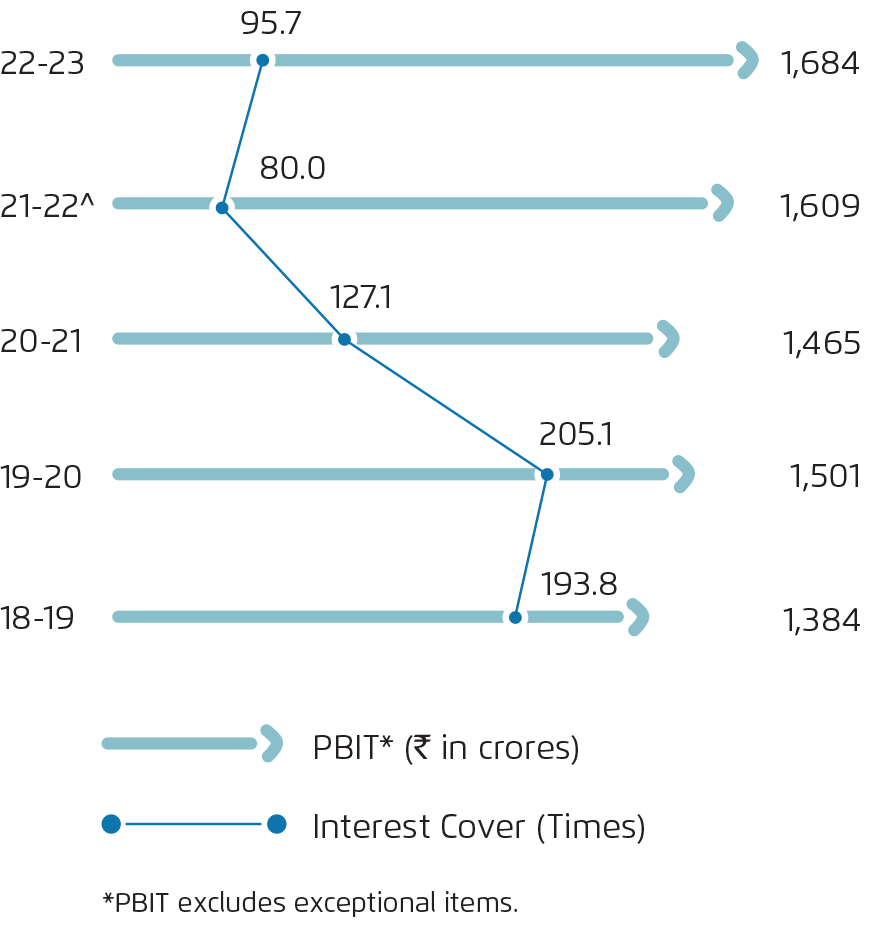
PBIT & Interest Cover
PBT & PBT As % To Net Sales
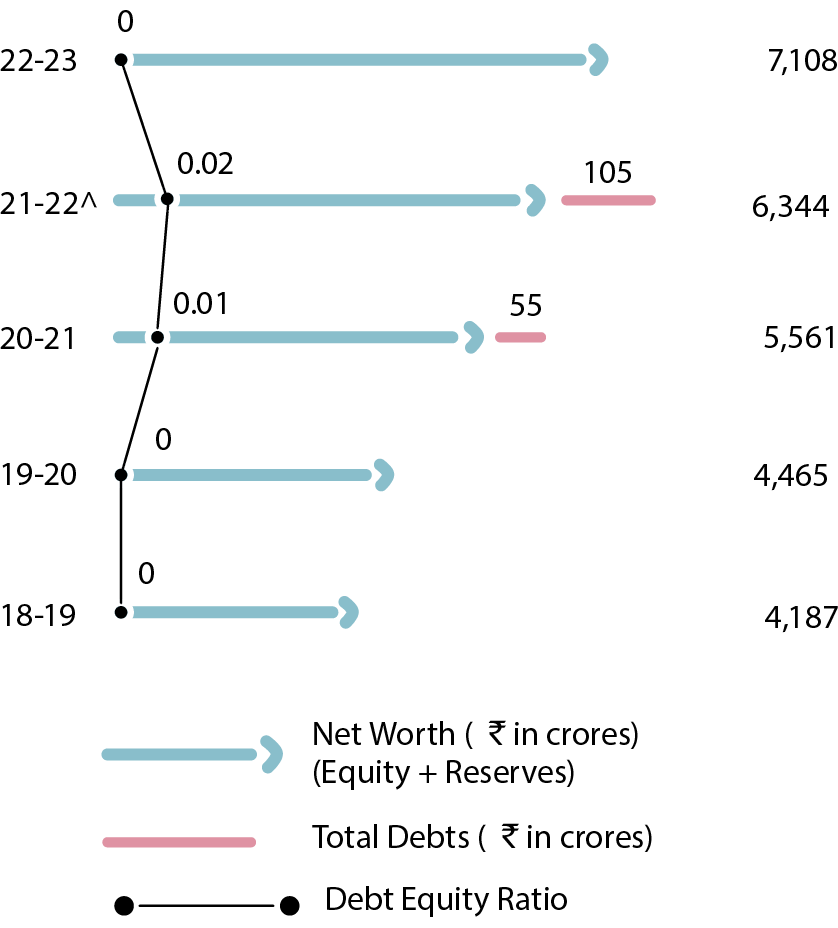
Debt Equity
Ratio
Value Addition To Business Through Reserves
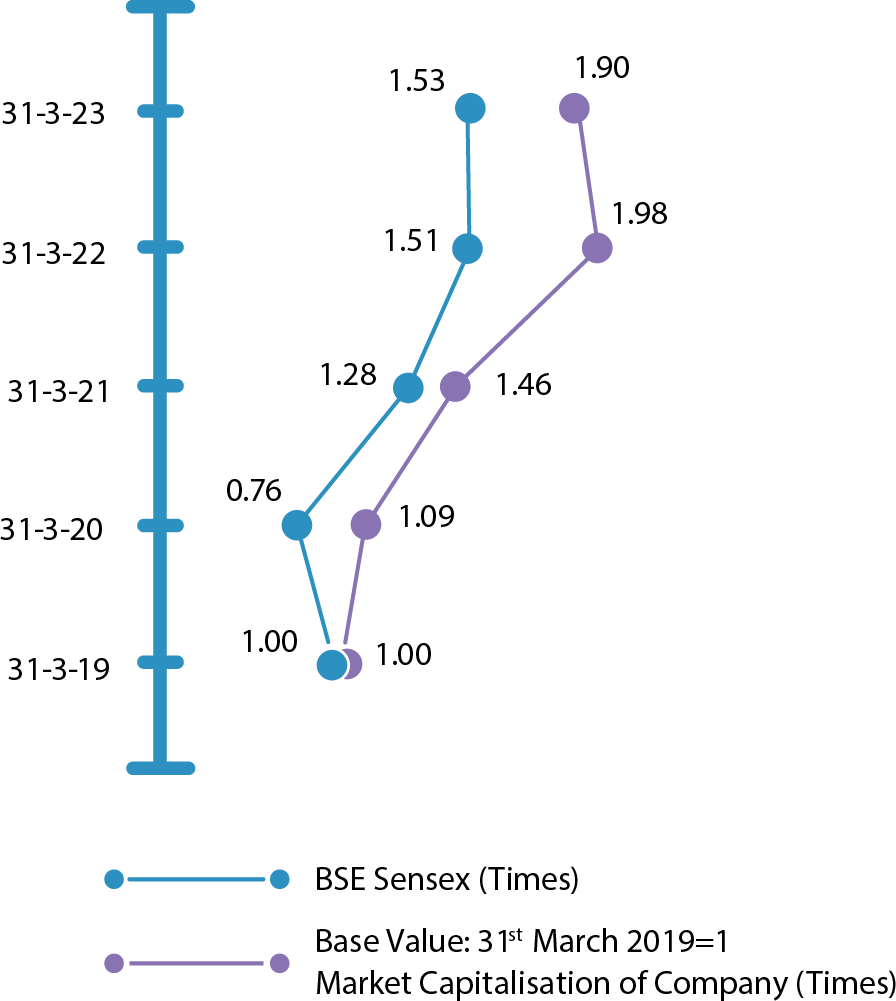
Growth In Market Capitalisation Of Company And BSE SENSEX Since 31st March 2019

^ Previous year’s figures restated on account of merger (refer Note 56 of Standalone Financial Statements)