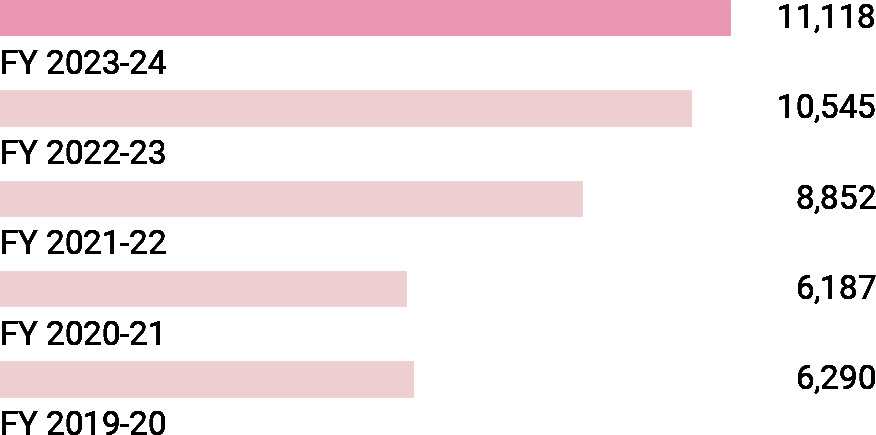
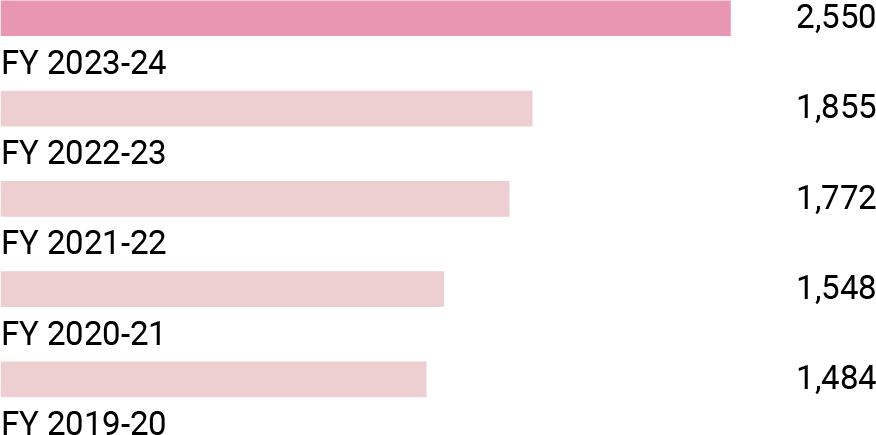
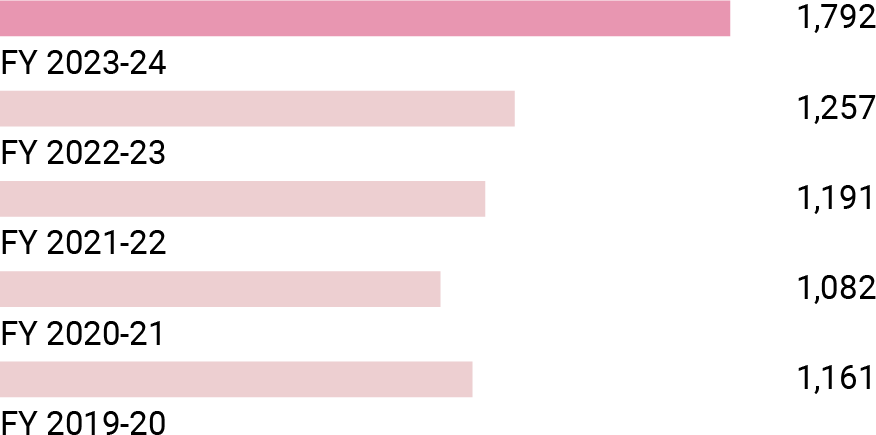
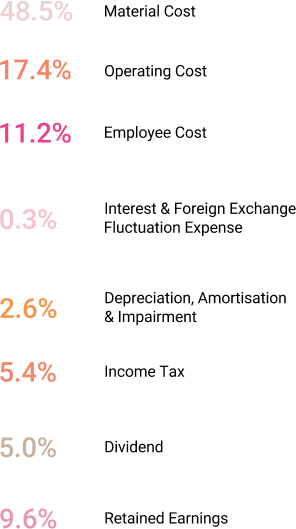
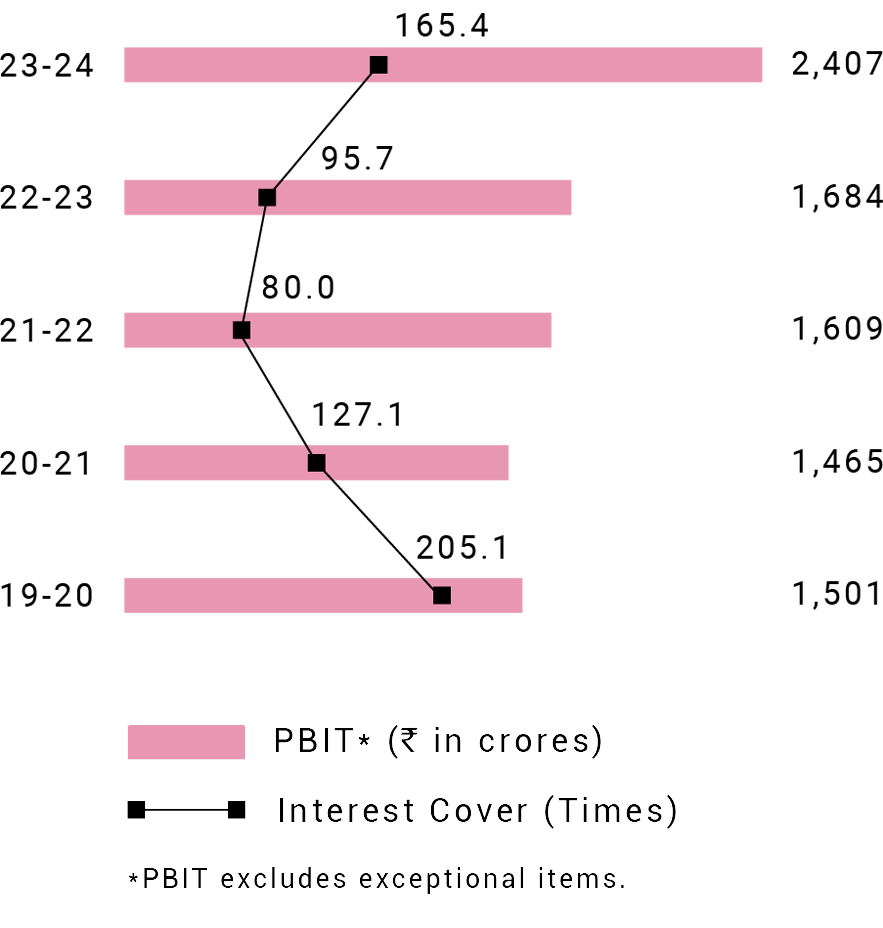
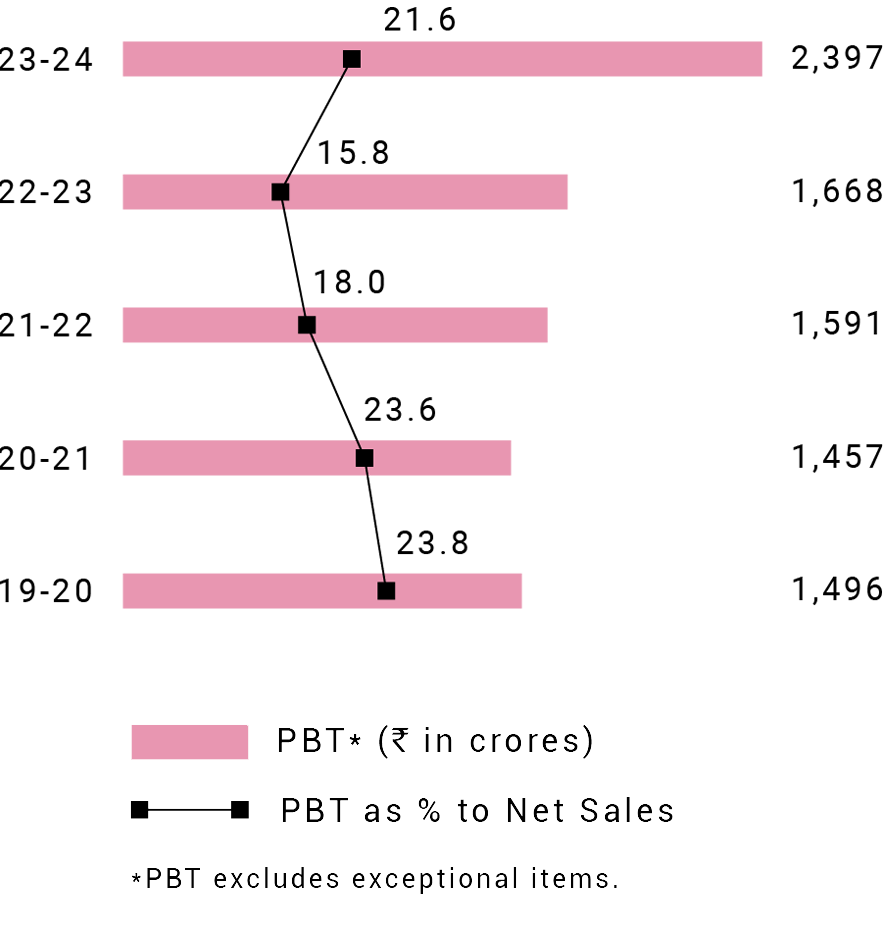
(excluding exceptional items)
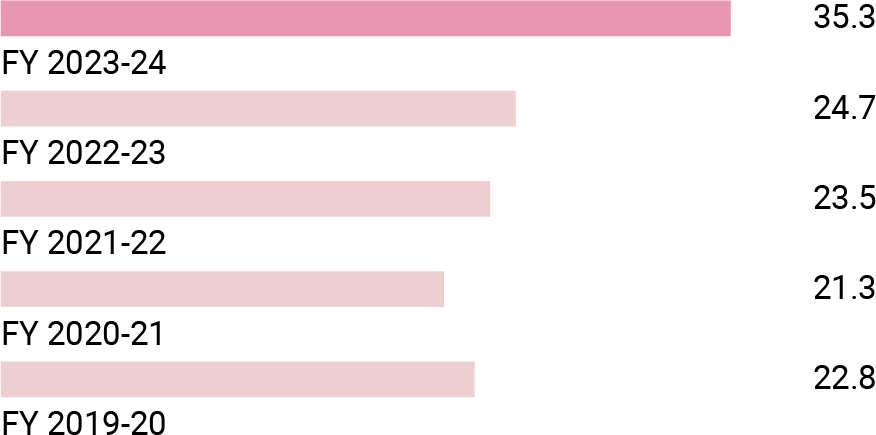
Y - O - Y Growth/Degrowth
*EBITDA = Profit before tax and exceptional items (PBT) + finance cost + Depreciation - other income