
Page 147 - Annual Report 2019-20
P. 147
Notes forming part of the financial statements Notes forming part of the financial statements 145
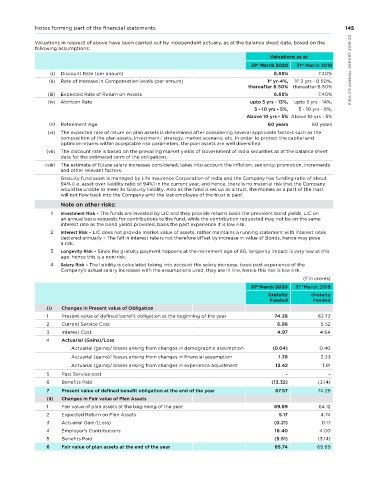
Valuations in respect of above have been carried out by independent actuary, as at the balance sheet date, based on the
following assumptions:
45 Employee Benefits Valuations as at
31 March 2020 31 March 2019
st
st
The Company has classified various employee benefits as under: PIDILITE ANNUAL REPORT 2019-20
(i) Discount Rate (per annum) 6.65% 7.40%
(A) Defined Contribution Plans (ii) Rate of increase in Compensation levels (per annum) 1 yr-4%, 1 2 yrs - 8.50%,
st
st
thereafter 6.50% thereafter 6.50%
(a) Provident Fund
(iii) Expected Rate of Return on Assets 6.65% 7.40%
(b) Superannuation Fund (iv) Attrition Rate upto 5 yrs - 13%, upto 5 yrs - 14%,
5 - 10 yrs - 5%, 5 - 10 yrs - 8%,
(c) State Defined Contribution Plans
Above 10 yrs - 5% Above 10 yrs - 5%
- Employers' Contribution to Employees' State Insurance (v) Retirement Age 60 years 60 years
- Employers' Contribution to Employees' Pension Scheme 1995 (vi) The expected rate of return on plan assets is determined after considering several applicable factors such as the
composition of the plan assets, investment/ strategy, market scenario, etc. In order to protect the capital and
- Labour Welfare Fund optimise returns within acceptable risk parameters, the plan assets are well diversified.
(vii) The discount rate is based on the prevailing market yields of Government of India securities as at the balance sheet
(d) national Pension Scheme date for the estimated term of the obligations.
(viii) The estimate of future salary increases considered, takes into account the inflation, seniority, promotion, increments
and other relevant factors.
The Company has recognised the following amounts in the Statement of Profit and Loss: Gratuity fund asset is managed by Life Insurance Corporation of India and the Company has funding ratio of about
( in crores) 94% (i.e. asset over liability ratio of 94%) in the current year, and hence, there is no material risk that the Company
For the For the would be unable to meet its Gratuity liability. Also as the fund is set up as a trust, the monies as a part of the trust
year ended year ended will not flow back into the Company until the last employee of the trust is paid.
31 March 31 March
st
st
2020 2019 Note on other risks:
(i) Contribution to Provident Fund 17.56 14.23 1 Investment Risk – The funds are invested by LIC and they provide returns basis the prevalent bond yields, LIC on
an annual basis requests for contributions to the fund, while the contribution requested may not be on the same
interest rate as the bond yields provided, basis the past experience it is low risk.
(ii) Contribution to Employees’ Superannuation Fund 0.87 0.84
2 Interest Risk – LIC does not provide market value of assets, rather maintains a running statement with interest rates
(iii) Contribution to Employees’ State Insurance Scheme 0.20 0.25 declared annually – The fall in interest rate is not therefore offset by increase in value of Bonds, hence may pose
a risk.
(iv) Contribution to Employees’ Pension Scheme 1995 8.65 7.31 3 Longevity Risk – Since the gratuity payment happens at the retirement age of 60, longevity impact is very low at this
age, hence this is a non-risk.
(v) Contribution to national Pension Scheme 2.80 1.88
4 Salary Risk – The liability is calculated taking into account the salary increase, basis past experience of the
TOTAL 30.08 24.51 Company’s actual salary increases with the assumptions used, they are in line, hence this risk is low risk.
( in crores)
(B) Defined Benefit Plans
31 March 2020 31 March 2019
st
st
Gratuity Gratuity Gratuity
Funded Funded
(C) Other Long-Term Benefits (i) Changes in Present value of Obligation
(a) Compensated Absences 1 Present value of defined benefit obligation at the beginning of the year 74.28 62.72
2 Current Service Cost 6.98 5.52
(b) Anniversary Awards
3 Interest Cost 4.97 4.64
(c) Premature Death Pension Scheme 4 Actuarial (Gains)/Loss
Actuarial (gains)/ losses arising from changes in demographic assumption (0.04) 0.40
(d) Total Disability Pension Scheme
Actuarial (gains)/ losses arising from changes in financial assumption 1.28 2.33
Actuarial (gains)/ losses arising from changes in experience adjustment 13.42 1.81
-
5 6 Past Service cost (13.32) - (3.14)
PIDILITE ANNUAL REPORT 2019-20 (ii) Changes in Fair value of Plan Assets 69.89 64.12
Benefits Paid
87.57
Present value of defined benefit obligation at the end of the year
7
74.28
1
Fair value of plan assets at the beginning of the year
5.17
2
Expected Return on Plan Assets
4.74
(0.21)
3
Actuarial Gain/(Loss)
0.17
16.40
4.00
4
(3.14)
5
Benefits Paid
85.74
Fair value of plan assets at the end of the year
6 Employer's Contributions (5.51) 69.89
144