
Page 229 - Annual Report 2019-20
P. 229
Notes forming part of the consolidated financial statements Notes forming part of the consolidated financial statements 227
48 segment information 49 Employee stock Option scheme
Business Segment: The Company operates in two business segments namely Consumer & Bazaar (C&B) and Business to Business
(B2B). C&B segment covers sale of products mainly to end consumers which are retail users such as carpenters, painters, plumbers, a) Details of Employee Share Options
mechanics, households, students, offices, etc. Sale consists of mainly Adhesives, Sealants, Art and craft Materials and Construction
and paint Chemicals. B2B covers sale of products to end customers which are mainly large business users. This includes Industrial In the Annual General Meeting of the Company held on 24 July 2012, the shareholders approved the issue of 50,76,486
th
Products (IP) such as adhesives, synthetic resins, organic pigments, pigment preparations, construction chemicals (projects), equity shares under the Scheme titled “Employee Stock Option Scheme 2012” (ESOS 2012). The Board approved PIDILITE ANNUAL REPORT 2019-20
surfactants, etc. and caters to various industries like packaging, textiles, paints, joineries, printing inks, paper, leather, etc. Others
includes sale of speciality acetates, raw materials etc. Employees Stock Option Scheme covering 3,00,000 Stock options, in terms of the regulations of the Securities and
During the year, the Company has re-organised its internal reporting, whereby the Chief Operating Decision Maker (CODM) evaluates Exchange Board of India.
the business activities and operating results of IP segments and certain business units which was until previous year shown under The ESOS 2012 allows the issue of options to Eligible employees of the Company. Each option comprises one underlying
C&B segment, are now reclassified under new B2B segment, based on customer type. Therefore, in accordance with ‘Ind AS 108 – equity share. The exercise price of each option shall be 1/- per equity share. The options vest in the manner as specified
Operating Segments’, the segment information for C&B and IP segments pertaining to these business units in respect of previous in ESOS 2012. Options may be exercised within 5 years from the date of vesting.
year reported have been regrouped, respectively to C&B and B2B segments. Operating Segment disclosures are consistent with the
information provided to and reviewed by the Managing Director (Chief Operating Decision Maker). ESOP 2016 covering grant of 45,00,000 options (including 2,50,000 Options to be granted to Eligible Employees/
( in crores) Directors of the subsidiary Companies) was approved by the shareholders through Postal Ballot on 2 April 2016. Each
nd
Business Segments Year 2019-20 Year 2018-19 option comprises one underlying equity share. The exercise price shall be 1/- per option or such other higher price as
Consumer Business Others Total Consumer Business Others Total may be fixed by the Board or Committee. Options to be granted under the Plan shall vest not earlier than one year but
& Bazaar to & Bazaar to not later than a maximum of six years from the date of grant of such options. In the case of Eligible Employee who has
Business Business not completed 3 years of employment as on date of the grant of Options then the Options which are due for vesting
Revenue before completion of 3 years as above, shall vest as on the completion of 3 years of employment in the Company by the
Segment Revenue 5,573.85 1,796.81 76.45 7,447.11 5,419.18 1,730.22 89.86 7,239.26 Employee concerned or as may be approved by the nomination and Remuneration Committee. Vested Options will have
to be exercised within 3 years from the date of respective vesting
Less: Inter Segment Revenue (24.19) (127.53) (0.92) (152.64) (36.84) (122.80) (1.66) (161.30)
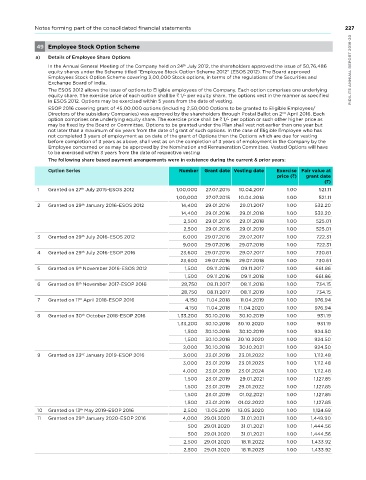
(at cost plus fixed margin) The following share based payment arrangements were in existence during the current & prior years:
Net Revenue 5,549.66 1,669.28 75.53 7,294.47 5,382.34 1,607.42 88.20 7,077.96
Revenue based on geography Option Series Number Grant date Vesting date Exercise Fair value at
price ( )
grant date
India 6,132.03 6,040.46 ( )
Outside India 1,162.44 1,037.50 1 Granted on 27 July 2015-ESOS 2012 1,00,000 27.07.2015 10.04.2017 1.00 521.11
th
Segment Result 1,547.26 271.00 (4.55) 1,813.71 1,386.65 216.02 (7.99) 1,594.68
unallocable Expenses (391.45) (345.40) 1,00,000 27.07.2015 10.04.2018 1.00 521.11
th
unallocable Income 109.21 102.21 2 Granted on 29 January 2016-ESOS 2012 14,400 29.01.2016 29.01.2017 1.00 532.20
Operating Income 1,531.47 1,351.49 14,400 29.01.2016 29.01.2018 1.00 532.20
Finance Cost (33.60) (26.07) 2,500 29.01.2016 29.01.2018 1.00 525.01
Interest/ Dividend Income 24.05 30.62 2,500 29.01.2016 29.01.2019 1.00 525.01
Share of Profit of Associates/ Joint 3.03 3.60
th
Ventures 3 Granted on 29 July 2016-ESOS 2012 6,000 29.07.2016 29.07.2017 1.00 722.31
Profit Before Tax and Exceptional items 1,524.95 1,359.64 9,000 29.07.2016 29.07.2018 1.00 722.31
Exceptional items 55.19 18.02 4 Granted on 29 July 2016-ESOP 2016 23,600 29.07.2016 29.07.2017 1.00 730.61
th
Profit Before Tax 1,469.76 1,341.62 23,600 29.07.2016 29.07.2018 1.00 730.61
Tax Expense 347.72 413.23
th
Profit for the year 1,122.04 928.39 5 Granted on 9 november 2016-ESOS 2012 1,500 09.11.2016 09.11.2017 1.00 661.86
Other Comprehensive Income 3.54 2.77 1,500 09.11.2016 09.11.2018 1.00 661.86
Total Comprehensive Income 1,125.58 931.16 6 Granted on 8 november 2017-ESOP 2016 28,750 08.11.2017 08.11.2018 1.00 734.15
th
non-Controlling Interest 5.75 3.43 28,750 08.11.2017 08.11.2019 1.00 734.15
Total Comprehensive Income attributable 1,119.83 927.73
th
to shareholders 7 Granted on 11 April 2018-ESOP 2016 4,150 11.04.2018 11.04.2019 1.00 976.94
The above includes: 4,150 11.04.2018 11.04.2020 1.00 976.94
Depreciation, Amortisation and Impairment 84.02 33.26 3.86 121.14 72.45 24.21 2.82 99.48 8 Granted on 30 October 2018-ESOP 2016 1,33,200 30.10.2018 30.10.2019 1.00 931.19
th
(allocable)
Depreciation, Amortisation and Impairment 48.78 33.26 1,33,200 30.10.2018 30.10.2020 1.00 931.19
(unallocable) 1,500 30.10.2018 30.10.2019 1.00 924.50
Capital Expenditure (including Capital 265.95 115.78 6.14 387.87 158.19 52.35 11.49 222.03
Work-In-Progress) (allocable) 1,500 30.10.2018 30.10.2020 1.00 924.50
Capital Expenditure (unallocable) 31.88 39.92 2,000 30.10.2018 30.10.2021 1.00 924.50
Capital Expenditure 419.75 261.95 9 Granted on 23 January 2019-ESOP 2016 3,000 23.01.2019 23.01.2022 1.00 1,112.48
rd
India 388.08 239.75
Outside India 31.67 22.20 3,000 23.01.2019 23.01.2023 1.00 1,112.48
There is no transactions with single external customer which amounts to 10% or more of the Company’s revenue As at 31 March 2019 4,000 23.01.2019 23.01.2024 1.00 1,112.48
PIDILITE ANNUAL REPORT 2019-20 Segment Assets 3,070.32 1,382.59 76.36 2,006.43 2,608.25 Business 79.24 3,860.71 10 Granted on 13 May 2019-ESOP 2016 4,000 29.01.2020 13.05.2020 1.00 1,449.90
29.01.2021
1.00
23.01.2019
1,500
1,127.85
Segment Assets & Liabilities
As at 31 March 2020
st
st
1,127.85
1,500
1.00
23.01.2019
29.01.2022
Total
Consumer
Business Others
Consumer Business Others
Total
& Bazaar
to
to
& Bazaar
01.02.2021
1,127.85
23.01.2019
1,500
Business
01.02.2022
1,500
1,127.85
23.01.2019
1.00
1,173.22
4,529.27
unallocable Assets
2,053.80
13.05.2019
1.00
2,500
1,124.69
th
5,914.51
Total Assets
6,535.70
11
Granted on 29 January 2020-ESOP 2016
31.01.2021
1.00
th
5,871.94
5,409.18
India
500
31.01.2021
1,444.56
1.00
29.01.2020
663.76
Outside India
505.33
500
1,663.28
1.00
1,433.92
29.01.2020
18.11.2022
unallocable Liabilities
201.16
228.28
1,559.27
Total Liabilities
2,500
29.01.2020
1,433.92
18.11.2023
1.00
226 Segment Liabilities 962.11 696.40 4.77 1,864.44 746.08 573.92 10.99 1,330.99 2,500 29.01.2020 31.01.2021 1.00 1,444.56
Capital Employed 4,671.26 4,355.24