
Page 209 - Annual Report 2019-20
P. 209
notes forming part of the consolidated financial statements notes forming part of the consolidated financial statements 207
( in crores) ( in crores)
10 Trade Receivables 13 Other Financial Assets - Non-Current
As at As at As at As at
31 March 31 March 31 March 31 March PIDILITE ANNUAL REPORT 2019-20
st
st
st
st
2020 2019 2020 2019
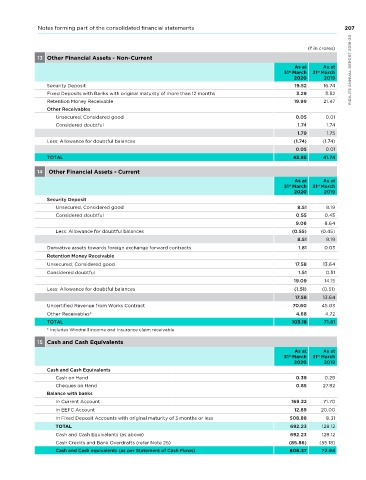
Secured, Considered good 105.20 87.67 Security Deposit 19.52 16.74
unsecured, Considered good 983.30 968.34 Fixed Deposits with Banks with original maturity of more than 12 months 3.29 3.52
Retention Money Receivable 19.99 21.47
unsecured, Considered doubtful 77.52 68.44
Other Receivables
unsecured which have Significant Increase in Credit Risk - -
unsecured, Considered good 0.05 0.01
unsecured, Credit Impaired - -
Considered doubtful 1.74 1.74
1,166.02 1,124.45
1.79 1.75
Less: Allowance for expected credit loss (77.52) (68.44) Less: Allowance for doubtful balances (1.74) (1.74)
TOTAL 1,088.50 1,056.01 0.05 0.01
The Group has used a practical expedient by computing the expected credit loss allowance for trade receivables based on a TOTAL 42.85 41.74
provision matrix. The provision matrix takes into account historical credit loss experience and adjusted for forward-looking
information. The expected credit loss allowance is based on the ageing of the receivables days and the rates vary with the
business of Parent and each Subsidiary. 14 Other Financial Assets - Current
Trade receivables includes receivables from Companies/firms where directors are directors/members/partners As at As at
(refer note 47). 31 March 31 March
st
st
2020 2019
Movement in expected credit loss allowance Security Deposit
For the For the
year ended year ended unsecured, Considered good 8.51 8.19
31 March 31 March Considered doubtful 0.55 0.45
st
st
2020 2019
9.06 8.64
Balance at the beginning of the year 68.44 58.66
Less: Allowance for doubtful balances (0.55) (0.45)
Movement in expected credit loss allowance on trade receivables calculated at lifetime expected 9.08 9.78 8.51 8.19
credit losses
Balance at the end of the year 77.52 68.44 Derivative assets towards foreign exchange forward contracts 1.81 0.03
A formal credit policy has been framed and credit facilities are given to dealers within framework of credit policy. As per Retention Money Receivable
credit risk management mechanism, a policy for doubtful debt has been formulated and risk exposure related to receivable unsecured, Considered good 17.58 13.64
are identified based on criteria mentioned in policy and provided for credit loss allowance.
Considered doubtful 1.51 0.51
11 Loans - Non-Current 19.09 14.15
As at As at Less: Allowance for doubtful balances (1.51) (0.51)
31 March 31 March 17.58 13.64
st
st
2020 2019
uncertified Revenue from Works Contract 70.60 45.03
Unsecured, Considered good
Other Receivables* 4.68 4.72
Loans and Advances to Employees & Others* 4.09 3.06
TOTAL 103.18 71.61
Loans to Joint Venture* 4.97 4.36 * Includes Windmill income and Insurance claim receivable.
Less: Impairment in value of loan** (4.97) (4.36)
15 Cash and Cash Equivalents
- -
As at As at
TOTAL 4.09 3.06
31 March 31 March
st
st
* Loans given for business purpose. 2020 2019
** During the year, Group has recognised impairment amounting to Nil crores ( 4.36 crores for the year ended 31 March 2019) Cash and Cash Equivalents
st
for the loan given to Joint Venture and Nil crores ( 1.77 crores for the year ended 31 March 2019) for investment made in Joint Cash on hand 0.39 27.82
st
PIDILITE ANNUAL REPORT 2019-20 Unsecured, Considered good 31 March 31 March Balance with banks 508.88 20.00
0.29
Venture (refer note 41).
Cheques on hand
0.85
12 Loans - Current
As at
As at
71.70
169.22
In Current Account
st
st
12.89
In EEFC Account
2020
2019
In Fixed Deposit Accounts with original maturity of 3 months or less
8.31
692.23
TOTAL
128.12
17.38
Loans and Advances to Employees & Others*
12.12
128.12
TOTAL
(85.86)
Cash Credits and Bank Overdrafts (refer note 25)
*Loans given for business purpose. 17.38 12.12 Cash and Cash Equivalents (as above) 692.23 (55.18)
206 Cash and Cash equivalents (as per Statement of Cash Flows) 606.37 72.94