
Page 37 - Annual Report 2019-20
P. 37
35
PIDILITE ANNUAL REPORT 2019-20
(` in crores) (` in crores)
I GAAP IND AS I GAAP IND AS
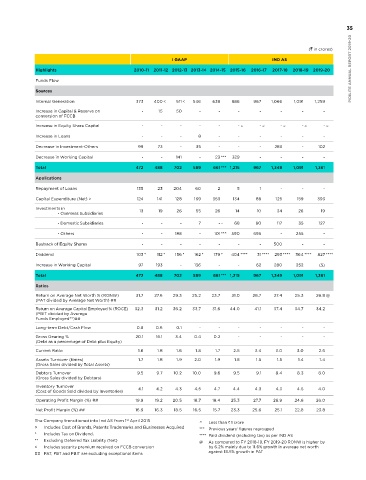
Highlights 2010-11 2011-12 2012-13 2013-14 2014-15 2015-16 2016-17 2017-18 2018-19 2019-20 CAGR % Highlights 2010-11 2011-12 2012-13 2013-14 2014-15 2015-16 2016-17 2017-18 2018-19 2019-20
Operating Results Funds Flow
Sales and Other Income 2,530 3,017 3,615 4,169 4,724 5,134 5,409 5,627 6,285 *** 6,484 11.0% Sources
Manufacturing & Other Expenses 2,036 2,483 2,939 3,448 3,918 3,942 4,070 4,197 4,796 4,847 10.1% Internal Generation 373 400 < 511 < 546 638 886 967 1,066 1,091 1,259
Operating Profit 494 534 676 721 806 1,192 1,339 1,430 1,490 1,637 14.2% Increase in Capital & Reserve on - 15 50 - - - - - - -
conversion of FCCB
Interest (Net) 27 21 8 10 10 6 6 6 7 13 (7.4%)
Increase in Equity Share Capital - - - - - - ~ - ~ - ~ - ~ - ~
Depreciation 44 48 53 69 108 88 90 91 100 126 12.3%
Increase in Loans - - - 8 - - - - - -
Profit from Ordinary Activities 423 465 615 642 688 1,098 1,243 1,333 1,383 1,498 15.1%
Decrease in Investment-Others 99 73 - 35 - - - 283 - 102
Exceptional Item 25 13 (6) 6 18 27 94 - - 59 10.1%
Decrease in Working Capital - - 141 - 23 *** 329 - - - -
Foreign Exchange Difference - 1 8 1 5 2 1 4 2 6 2 9.3%
Expense/(Income) Total 472 488 702 589 661 *** 1,215 967 1,349 1,091 1,361
Profit-Before Tax 397 444 620 631 668 1,070 1,145 1,331 1,376 1,437 15.4% Applications
Current Tax 94 105 156 160 156 299 363 403 438 369 16.4%
Repayment of Loans 135 23 204 60 2 5 1 - - -
Deferred Tax (1) 4 3 2 11 24 8 19 11 (33) 57.2%
Capital Expenditure (Net) > 124 141 128 169 353 134 88 125 159 393
Profit-After Tax for the year 304 335 461 469 501 747 774 909 927 1102 15.4%
Investments in 13 19 26 55 26 14 10 34 26 19
- Overseas Subsidiaries
Add: Prior Year's Tax Provision - - - - - - - 46 53 - -
written back
- Domestic Subsidiaries - - - 7 - ~ 68 80 117 35 127
Profit-After Tax 304 335 461 469 501 747 $ 774 $ 955 $ 979 $ 1,102 $ 15.4%
- Others - - 188 - 101 *** 590 695 - 255 -
Dividend on Equity Shares 103 * 112 * 156 * 162 * 179 * 404 **** 31 **** 293 **** 364 **** 827**** 26.1%
Buyback of Equity Shares - - - - - - - 500 - -
Retained Earning 201 223 305 307 322 343 743 662 615 275 3.5%
Dividend 103 * 112 * 156 * 162 * 179 * 404 **** 31 **** 293 **** 364 **** 827 ****
Financial Position
Increase in Working Capital 97 193 - 136 - - 62 280 252 (5)
Capital-Equity 51 51 51 51 51 51 51 51 51 51 0.0%
Total 472 488 702 589 661 *** 1,215 967 1,349 1,091 1,361
Reserve (Less Revaluation 1,088 1,327 1,682 1,988 2,298 2,599 3,348 3,513 4,136 4,414 16.8%
Reserve & Misc. Expenditure) Ratios
Return on Average Net Worth % (RONW) 31.7 27.6 29.3 25.2 23.7 31.0 28.7 27.4 25.3 26.8 @
Net Worth 1,139 1,378 1,733 2,039 2,349 2,650 3,399 3,564 4,187 4,465 16.4%
(PAT divided by Average Net Worth) ##
Borrowings 287 264 60 8 6 1 - - - - - Return on Average Capital Employed % (ROCE) 32.3 31.2 36.2 33.7 31.6 44.0 41.1 37.4 34.7 34.2
(PBIT divided by Average
Deferred Tax Liability (Net) 41 45 48 51 55 75 84 103 113 76 7.1% Funds Employed**)##
Funds Employed 1,467 1,687 1,841 2,098 2,410 2,726 3,483 3,667 4,300 4,541 13.4% Long-term Debt/Cash Flow 0.8 0.6 0.1 - - - - - - -
Fixed Assets ** Gross Gearing % 20.1 16.1 3.4 0.4 0.2 - - - - -
(Debt as a percentage of Debt plus Equity)
Gross Block 1,205 1,343 1,469 1,637 2,005 1,775 1,856 1,975 2,110 2,538 8.6%
Current Ratio 1.6 1.8 1.6 1.8 1.7 2.5 3.4 3.0 3.0 2.6
Depreciation 431 476 527 594 716 707 790 871 930 1041 10.3% Assets Turnover (times) 1.7 1.8 1.9 2.0 1.9 1.8 1.5 1.5 1.4 1.4
(Gross Sales divided by Total Assets)
Net Block 774 867 942 1,043 1,288 1,068 1,066 1,104 1,180 1,497 7.6%
Debtors Turnover 9.5 9.7 10.2 10.0 9.6 9.5 9.1 8.4 8.3 8.0
Investments in 233 # 239 # 260 # 259 360 *** 355 # 1,523 1,483 1,860 1,496 27.6% (Gross Sales divided by Debtors) 4.1 4.2 4.3 4.5 4.7 4.4 4.3 4.3 4.5 4.0
PIDILITE ANNUAL REPORT 2019-20 The Company transitioned into Ind AS from 1 April 2015 1,841 2,098 2,410 ~ Less than ` 1 crore 3,667 4,300 4,541 13.4% The Company transitioned into Ind AS from 1 April 2015 19.2 20.5 16.5 ~ Less than ` 1 crore 25.6 26.9 24.6 26.0
303#
270 #
330#
3.9%
327#
341 #
315 #
- Overseas Subsidiaries
Inventory Turnover
(Cost of Goods Sold divided by Inventories)
287
- Others
167
94
748
25.3
19.9
18.4
18.7
Operating Profit Margin (%) ##
27.7
487
624
293
Net Current Assets
777
555
481
421 ***
17.2%
1,220
930
352
22.8
25.1
23.8
Net Profit Margin (%) ##
18.5
15.7
16.3
23.3
16.9
3,483
2,726
Total Assets
1,467 # 1,687
st
st
>
Includes Cost of Brands, Patents Trademarks and Businesses Acquired
*** Previous years’ figures regrouped
**** Paid dividend (including tax) as per IND AS
**
Including Capital Work-In-Progress and excluding Revalued Assets
Excluding Deferred Tax Liability (Net)
@
As compared to FY 2018-19, FY 2019-20 RONW is higher by
and Depreciation thereon
Profit is after tax but before Other Comprehensive Income
$
by 6.2% mainly due to 11.6% growth in average net worth
<
Includes security premium received on FCCB conversion
#
After deducting provision for diminution.
against 18.5% growth in PAT
34 * Includes Tax on Dividend *** Previous years’ figures regrouped * ** Includes Tax on Dividend. **** Paid dividend (including tax) as per IND AS
## PAT, PBT and PBIT are excluding exceptional items