
Page 35 - Annual Report 2019-20
P. 35
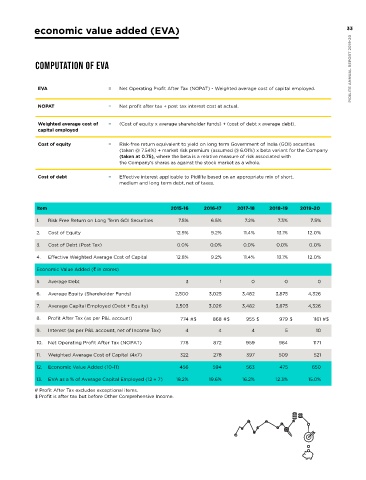
management discussion and analysis economic value added (EVA) 33
OUTLOOK Current Year Outlook sales and market share in COMPUTATION OF EVA
Bangladesh and Sri Lanka. PIDILITE ANNUAL REPORT 2019-20
During the first half of The US subsidiary plans to
FY 2020-21, economic activity maintain its focus on Retail
may remain subdued due to a and E-Commerce. The Brazil EVA = Net Operating Profit After Tax (NOPAT) - Weighted average cost of capital employed.
number of factors, such as subsidiary is taking initiatives
social distancing, subdued for continued growth in sales NOPAT = Net profit after tax + post tax interest cost at actual.
demand and labour shortage. and margins. The business
Recovery in economic activity environment in these countries
is expected to begin in second remain subdued as they Weighted average cost of = (Cost of equity x average shareholder funds) + (cost of debt x average debt).
half of FY 2020-21 depending all face the ongoing impact capital employed
on how eectively the country of the pandemic and
is able to contain the virus. consequent lockdown. Cost of equity = Risk-free return equivalent to yield on long term Government of India (GOI) securities
Overall there remains (taken @ 7.54%) + market risk premium (assumed @ 6.01%) x beta variant for the Company
significant uncertainty about Outlook on Opportunities, (taken at 0.75), where the beta is a relative measure of risk associated with
the duration of the pandemic Threats, Risks and Concerns the Company’s shares as against the stock market as a whole.
and the consequent downside
risks to domestic growth. The Indian economy provides Cost of debt = Effective interest applicable to Pidilite based on an appropriate mix of short,
a large opportunity to the medium and long term debt, net of taxes.
Continued slowdown in Company to market its
the construction industry dierentiated products.
and economic growth can Item 2015-16 2016-17 2017-18 2018-19 2019-20
negatively impact sales Slower growth of the Indian
growth for current year. economy and stress in sectors, 1. Risk Free Return on Long Term GOI Securities 7.5% 6.5% 7.2% 7.3% 7.5%
such as construction could
While major subsidiaries in impact the performance of 2. Cost of Equity 12.9% 9.2% 11.4% 13.1% 12.0%
India are taking initiatives to the Company.
improve margins and achieve 3. Cost of Debt (Post Tax) 0.0% 0.0% 0.0% 0.0% 0.0%
consistent sales growth in Overseas subsidiaries, by
their respective businesses, virtue of their relatively 4. Effective Weighted Average Cost of Capital 12.8% 9.2% 11.4% 13.1% 12.0%
the impact of the economic smaller size, remain vulnerable Economic Value Added (` in crores)
growth environment does to the political and economic
pose a risk to these plans. uncertainties of their 5. Average Debt 3 1 0 0 0
respective countries.
The Company’s major 6. Average Equity (Shareholder Funds) 2,500 3,025 3,482 3,875 4,326
international subsidiaries are COVID-19 related slowdown
in Bangladesh, Sri Lanka, may impact the performance 7. Average Capital Employed (Debt + Equity) 2,503 3,026 3,482 3,875 4,326
USA, Brazil, Thailand, Egypt of the Company and its
and Dubai. Various initiatives subsidiaries. 8. Profit After Tax (as per P&L account) 774 #$ 868 #$ 955 $ 979 $ 1161 #$
are being taken to increase 9. Interest (as per P&L account, net of Income Tax) 4 4 4 5 10
10. Net Operating Profit After Tax (NOPAT) 778 872 959 984 1171
MISCELLANEOUS OTHER MATTERS CAUTIONARY STATEMENT 11. Weighted Average Cost of Capital (4x7) 322 278 397 509 521
The Company’s Net Worth The following matters are Statements in this 12. Economic Value Added (10-11) 456 594 563 475 650
(Equity capital + Reserves) has elaborated in the Directors’ Management Discussion and # Profit After Tax excludes exceptional items. 18.2% 19.6% 16.2% 12.3% 15.0%
EVA as a % of Average Capital Employed (12 ÷ 7)
13.
PIDILITE ANNUAL REPORT 2019-20 crores as on 31 March 2020, . Risks and concerns projections, estimates and $ Profit is after tax but before Other Comprehensive Income.
Analysis Report describing
grown from ` 2,650 crores as
Report
the Company’s objectives,
on 31 March 2016 to ` 4,465
st
st
expectations may be ‘forward
giving a Compounded Annual
looking statements’ within the
Growth Rate (CAGR) of 13.93%.
. Internal control systems
meaning of applicable laws
and their adequacy
and regulations. Actual results
The market capitalisation of the
might dier.
Company on 31 March 2020
st
grown at a CAGR of 30.36 %
since the IPO in 1993.
32 was ` 68,935 crores and has