
Page 25 - Annual Report 2019-20
P. 25
PERFORMING 23
key performance indicators (standalone)
23
PIDILITE ANNUAL REPORT 2019-20 PIDILITE ANNUAL REPORT 2019-20
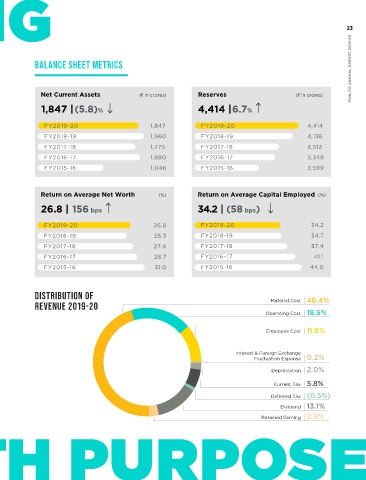
PROFIT AND LOSS METRICS BALANCE SHEET METRICS
Net Sales (` in crores) EBITDA (` in crores) Net Current Assets (` in crores) Reserves (` in crores)
6,290 | 4.0% 1,485 | 14.4% 1,847 | (5.8)% 4,414 | 6.7%
FY2019-20 6,290 FY2019-20 1,485 FY2019-20 1,847 FY2019-20 4,414
FY2018-19 6,047 FY2018-19 1,298 FY2018-19 1,960 FY2018-19 4,136
FY2017-18 5,309 FY2017-18 1,294 FY2017-18 1,775 FY2017-18 3,513
FY2016-17 4,837 FY2016-17 1,229 FY2016-17 1,880 FY2016-17 3,348
FY2015-16 4,703 FY2015-16 1,121 FY2015-16 1,046 FY2015-16 2,599
Profit After Tax (` in crores) Earnings Per Share (EPS) ( ` ) Return on Average Net Worth (%) Return on Average Capital Employed (%)
(excluding exceptional items)
1,161 | 18.5% 22.8 | 18.1% 26.8 | 156 bps 34.2 | (58 bps)
FY2019-20 1,161 FY2019-20 22.8 FY2019-20 26.8 FY2019-20 34.2
FY2018-19 979 FY2018-19 19.3 FY2018-19 25.3 FY2018-19 34.7
FY2017-18 955 FY2017-18 18.8 FY2017-18 27.4 FY2017-18 37.4
FY2016-17 868 FY2016-17 16.9 FY2016-17 28.7 FY2016-17 41.1
FY2015-16 774 FY2015-16 15.1 FY2015-16 31.0 FY2015-16 44.0
Book Value Per Share ( ` ) Dividend Per Share (DPS) ( ` ) Distribution of Material Cost 46.4%
87.9 | 6.7% 7.00* | 7.7% Revenue 2019-20 Operating Cost 18.5%
FY2019-20 87.9 FY2019-20 7.00*
Employee Cost 11.6%
FY2018-19 82.4 FY2018-19 6.50
FY2017-18 70.2 FY2017-18 6.00
Interest & Foreign Exchange
FY2016-17 66.3 FY2016-17 4.75 Fluctuation Expense 0.2%
FY2015-16 51.7 FY2015-16 4.15 Depreciation 2.0%
PIDILITE ANNUAL REPORT 2019-20 PIDILITE ANNUAL REPORT 2019-20 Retained Earning 2.9%
Current Tax 5.8%
*interim dividend considered as final dividend for FY 2019-20
Deferred Tax (0.5%)
Dividend 13.1%
Y-O-Y Growth/Degrowth WITH PURPOSE
22
22