
Page 26 - Annual Report 2019-20
P. 26
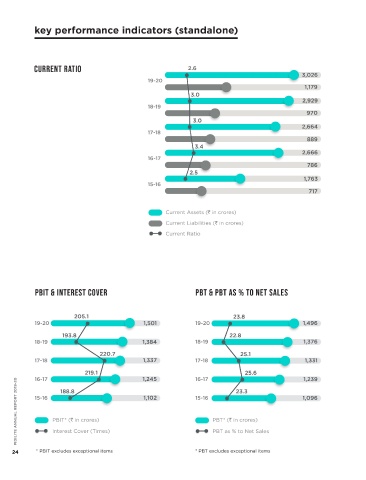
key performance indicators (standalone) 25
25
CURRENT RATIO 2.6 Debt Equity Ratio Value Addition to Business PIDILITE ANNUAL REPORT 2019-20 PIDILITE ANNUAL REPORT 2019-20
3,026
3,026
19-20
19-20 through Reserves
1,179
1,179
3.0
3.0
51
2,929
2,929 0 0 51
19-20
19-20
4,465
18-19
18-19 19-20 4,465 19-20 4,414
970
970 51
51
3.0 18-19 0 0 4,187 18-19 4,136
3.0
4,136
18-19
18-19
4,187
2,664
2,664
17-18 51
17-18
51
889
889 0 0 3,564 17-18 3,513
3,513
17-18
3,564
17-18
3.4 17-18
3.4
2,666 0 0 51
2,666
51
16-17 16-17 3,399 16-17 3,348
16-17
16-17
3,348
3,399
16-17
786
786
51
2.5
2.5 0 0 51
1,763 15-16 1 1 2,650 15-16 2,599
1,763
2,599
15-16
2,650
15-16
15-16
15-16
717
717
Current Assets (` in crores) Total Debt (` in crores) Share Capital (` in crores)
Current Liabilities (` in crores) Net Worth (` in crores) (Equity + Reserves) Reserves (` in crores)
Current Ratio Debt Equity Ratio
1.16
PBIT & Interest Cover PBT & PBT as % to Net Sales Growth in Market 1.16 2.27
2.27
Capitalisation of Company 31-3-20
and BSE sensex since 1.53 2.08
2.08
1.53
205.1
205.1 23.8 31-3-19
23.8
19-20
19-20
19-20 1,501 19-20 1,496 31st March 2016
1,496
1,501
1.30
1.30 1.54
1.54
193.8 22.8 31-3-18
22.8
193.8
1,384
18-19
18-19
18-19 1,384 18-19 1,376
1,376
1.17 1.18
1.17
1.18
220.7
25.1
220.7 25.1 31-3-17
1,331
1,337
17-18
17-18 1,337 17-18 1,331
17-18
1 1 1 1
219.1
219.1 1,245 16-17 23.3 1,239 31-3-16 st
25.6
25.6
1,245
1,239
16-17
16-17
16-17
PIDILITE ANNUAL REPORT 2019-20 PIDILITE ANNUAL REPORT 2019-20 15-16 PBIT* (` in crores) 1,102 15-16 PBT* (` in crores) 1,096 Base Value : 31 March 2016 =1
188.8
188.8
23.3
1,102
15-16
1,096
15-16
Market Capitalisation of Company (Times)
BSE Sensex (Times)
PBT as % to Net Sales
Interest Cover (Times)
24 * PBIT excludes exceptional items * PBT excludes exceptional items
24